
Fitting Cap for Factories: Your Guide to Reliable Sourcing
From my workshop to your production line, I bring you a reliable fitting cap designed for secure, quick connections in various piping systems. I know your team wants quality that lasts, and that’s why I’ve engineered this fitting cap with corrosion-resistant materials and tight tolerances. When you Buy from us, you’re choosing durability, easy installation, and low maintenance. My recommended sizes cover standard fittings, and the cap features a robust seal that prevents leaks under pressure. For Factories, this means less downtime and faster assembly on busy shifts. I’ve tested under high temp, vibration, and chemical exposure, so you can trust it in demanding environments. If you’re sourcing directly, this is a practical option for scale-up—versatile, cost-effective, and supported by responsive service. I’m ready to discuss quantity discounts, lead times, and a sample policy, so you can approve it before committing.

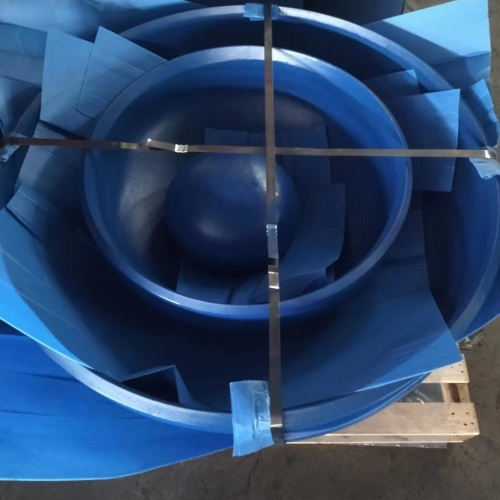
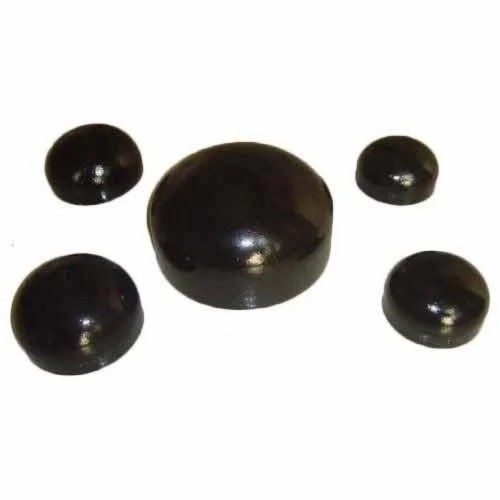
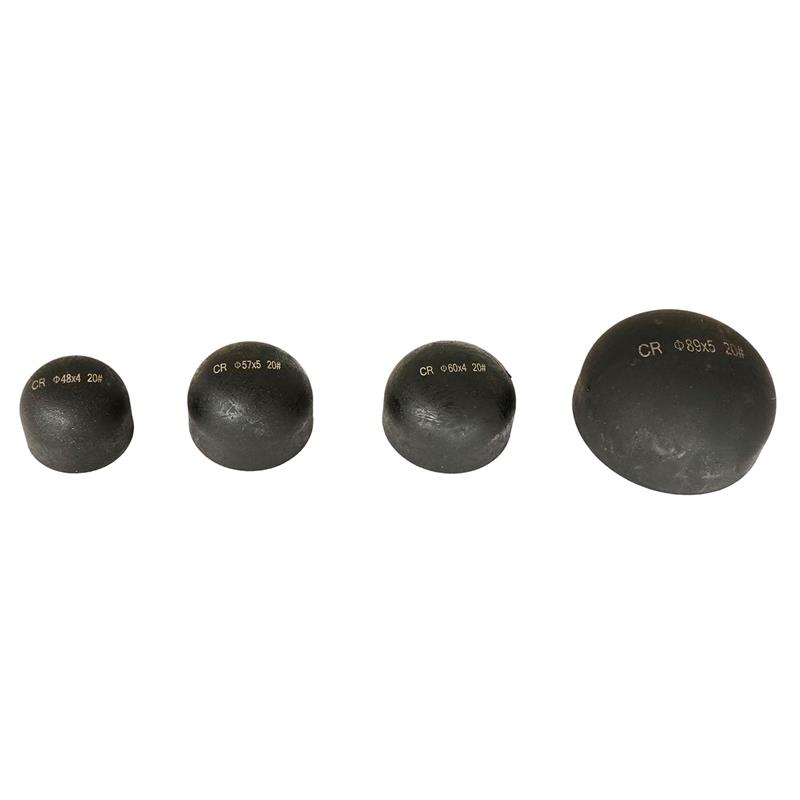
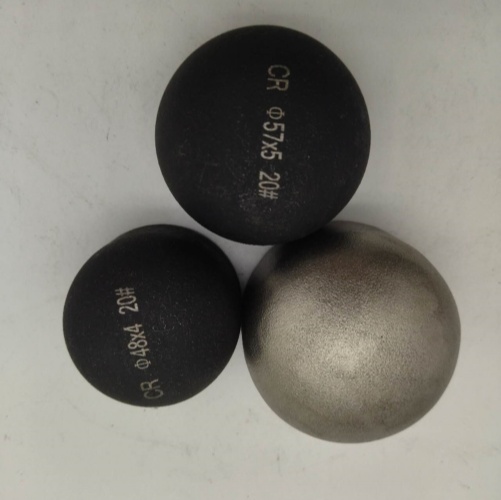

fitting cap Manufacturer Factory
As an experienced fitting cap manufacturer and factory serving global procurement needs, we produce precision pipe end caps in stainless steel, carbon steel, alloy and plastic across full size ranges and pressure classes. Our product line meets international standards (ASME, ASTM, DIN) and supports OEM/ODM customization for diameter, thickness, finish and marking to suit pipeline, oil & gas, petrochemical and water treatment projects. Equipped with advanced machining, forging and heat-treatment facilities, strict incoming material inspection and multi-stage quality control (dimensional checks, hydrostatic tests, PMI and coating inspections), we ensure consistent performance and traceability. Competitive pricing, flexible MOQs, rapid sampling and reliable packaging with coordinated global logistics make us a dependable partner for buyers seeking high-quality fitting caps and long-term supply solutions.
{ fitting cap Manufacturer Factory}
| Component | Material | Standard Sizes (mm) | Wall Thickness (mm) | Dimensional Tolerance (mm) | Surface Finish | Thread / Compatibility | Applicable Standards | Typical Manufacturing Methods | Common Tests | Suitable Applications | Max Continuous Temp (°C) |
|---|---|---|---|---|---|---|---|---|---|---|---|
| Butt-weld End Cap | HDPE (PE100) | 20 – 630 | 3 – 20 | ±0.5 | Extruded smooth | Butt-weld / Socket weld | ISO 4427, EN 12201 | Injection molding, Fabrication | Hydrostatic pressure, Dimensional inspection | Water distribution, underground mains | 60 |
| PVC Solvent-weld End Cap | PVC-U | 16 – 315 | 2 – 12 | ±0.3 | Injection-molded smooth | Solvent-weld / Socket | ASTM D1785, ISO 1452 | Injection molding | Visual, Leak test | Drainage, irrigation, DWV | 60 |
| Threaded Cap (metal) | Stainless steel 304 / 316 | 6 – 110 | 1 – 4 | ±0.2 | Polished / Passivated | BSP / NPT / Metric threads | ASTM A240, ISO 7-1 | CNC turning, Machining | Thread gauge, Material verification | Plumbing, instrumentation, process lines | 200 |
| Silicone Protective Cap | Silicone rubber (VMQ) | 3 – 100 | 1 – 3 | ±0.5 | Matte / soft-touch | Push-fit / Snap-fit | ASTM D2000 | Compression molding, Injection molding | Shore hardness, Thermal aging | Electrical connector protection, laboratory plugs | 180 |
| Aluminum Anodized Cap | Aluminum 6061 | 6 – 76 | 1 – 5 | ±0.2 | Anodized / machined | Compression / Push-fit | ASTM B209, ISO 9001 (manufacturing framework) | CNC machining, Stamping | Dimensional, Coating adhesion | HVAC, chassis end-caps, lightweight enclosures | 150 |
| EPDM Snap-on Cap | EPDM rubber | 10 – 200 | 1.5 – 4 | ±0.5 | Textured matte | Snap-on / Friction-fit | ASTM D2000 | Injection molding | Ozone resistance, Tensile test | Outdoor pipe ends, weather sealing | 120 |
| Brass Dust Cap (turned) | Brass C360 | 4 – 50 | 0.8 – 2.5 | ±0.15 | Nickel-plated / machined | Metric / UN threads, Push-fit | ISO 228-1 (threads), RoHS | Turning, Threading, Plating | Salt spray (coating), Thread gauge | Dust protection for hydraulic and pneumatic fittings | 120 |
Related Products
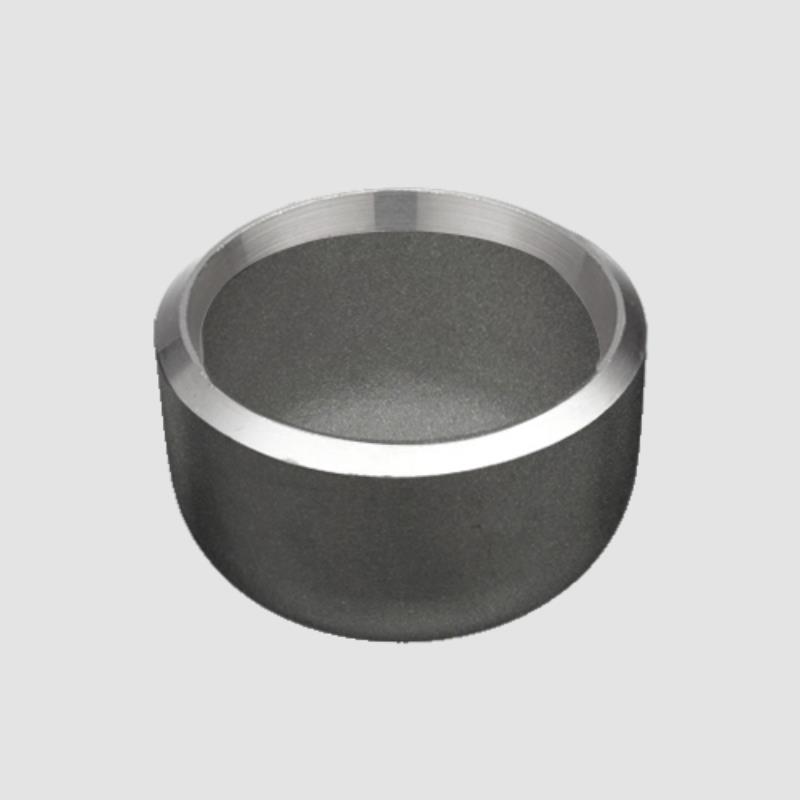
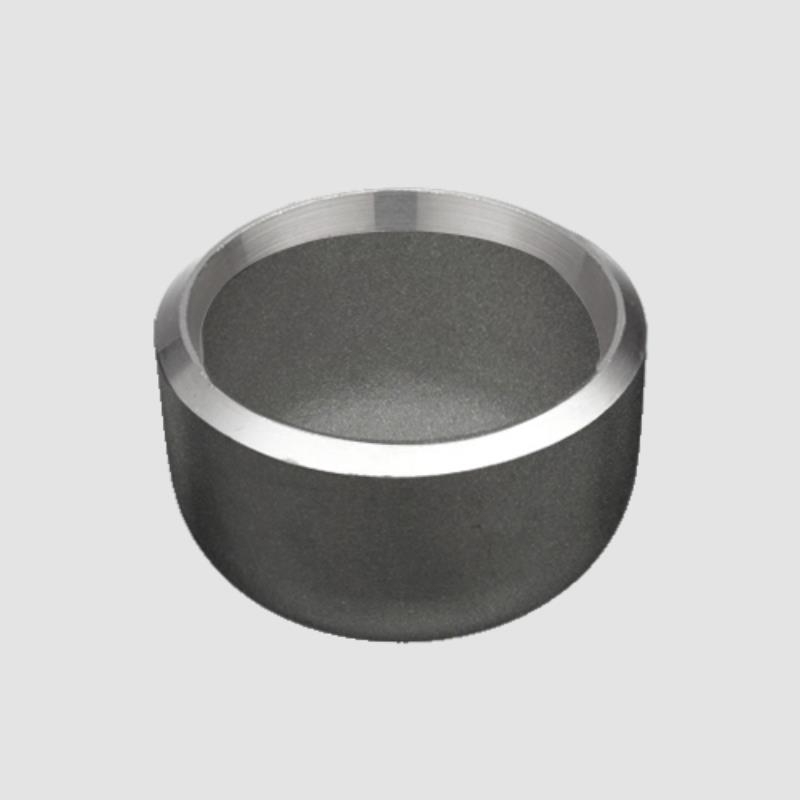
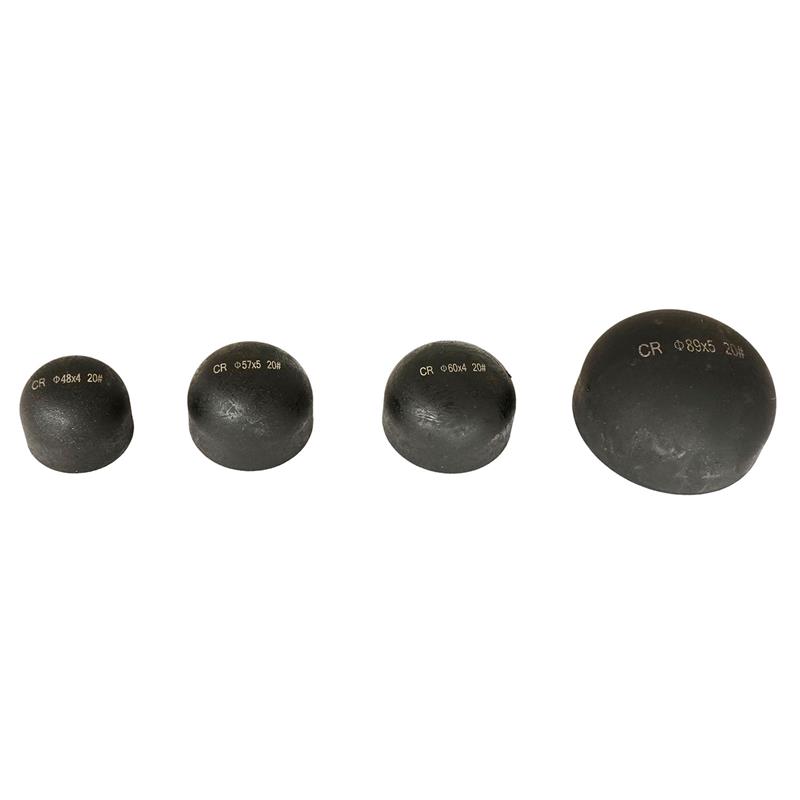
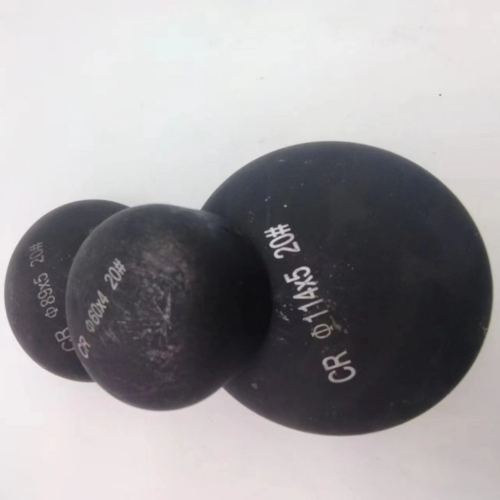
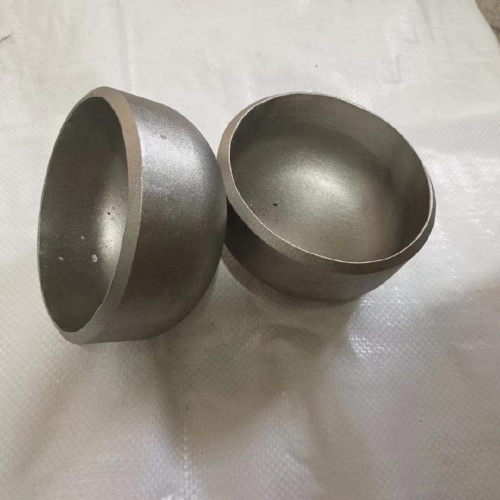

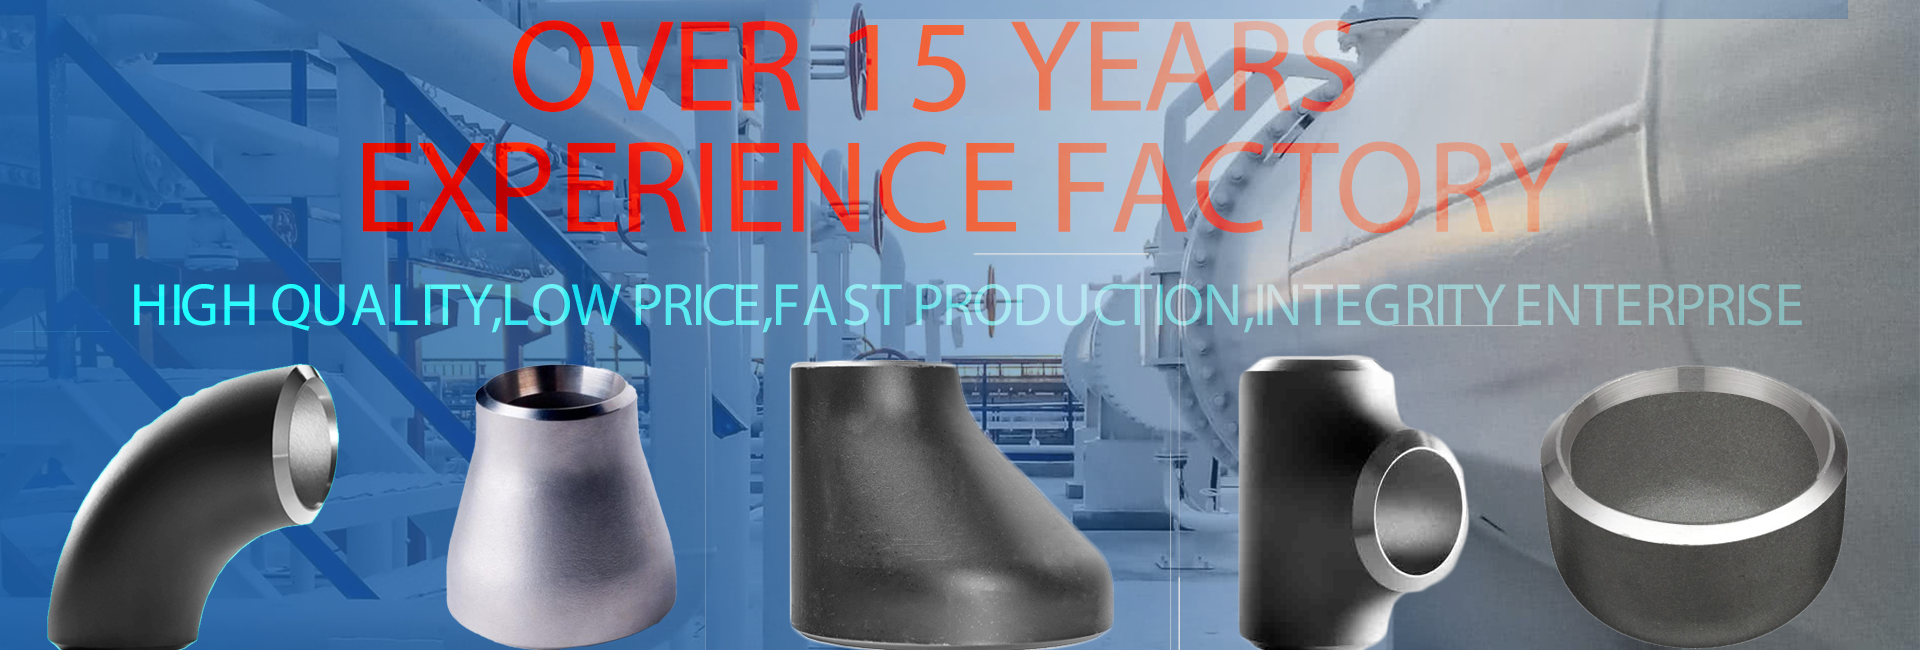
fitting cap For the Current Year Exceeds Industry Benchmarks
Top Selling Products


- Related Blog
- Reviews
- Reviews
